Dynamic Contagion and Systemic Risk in Sovereign CDS Markets

Introduction
In today’s global financial system, countries are closely connected. When one country faces financial stress, the impact can quickly spread to others. This makes it important to understand how risk moves across countries and whether we can predict it.
In this project, I analyze sovereign credit risk using CDS (Credit Default Swap) data from multiple countries. My goal is to understand how risks are connected and how they change over time.
How Risk Moves Across Countries?
Sovereign CDS spreads reflect how risky a country is. When markets are stable, countries may move independently. But during crises, such as COVID-19, risks tend to move together.
This shows that global risk is not constant—it becomes stronger and more connected during stressful periods.
Tracking Changing Relationships (DCC-GARCH)
To study how countries move together over time, I used a model called DCC-GARCH.
This model allows me to:
Track how correlations change over time
Identify when countries become more connected
For example, the U.S. and Mexico show consistently high correlation, meaning their risks often move together. During crises, this relationship becomes even stronger.

Looking at Extreme Risk (Copula Models)
Simple correlation cannot capture extreme events. To understand what happens during crises, I used copula models.
These models help capture:
Extreme downside risk (crashes)
Asymmetric behavior in markets
The results show that:
Countries are more connected during downturns than recoveries
Risk spreads more strongly in bad times

Who Sends and Receives Risk? (Spillover Analysis)
To understand how risk flows between countries, I used a spillover model.
This helps identify:
Which countries send risk
Which countries receive risk
Key findings:
Global risk is highly interconnected (about 70–85%)
Mexico often acts as a risk transmitter
Indonesia tends to be a risk receiver
This shows that global markets behave like a network, not isolated system


Detecting Crisis Periods (Regime Analysis)
Markets behave differently during normal times and crisis periods. To capture this, I used:
Structural break tests
Markov-switching models
The results show:
Markets are usually stable
A clear stress period appeared during COVID-19
Crisis periods are short but intense


Can We Predict Future Risk?
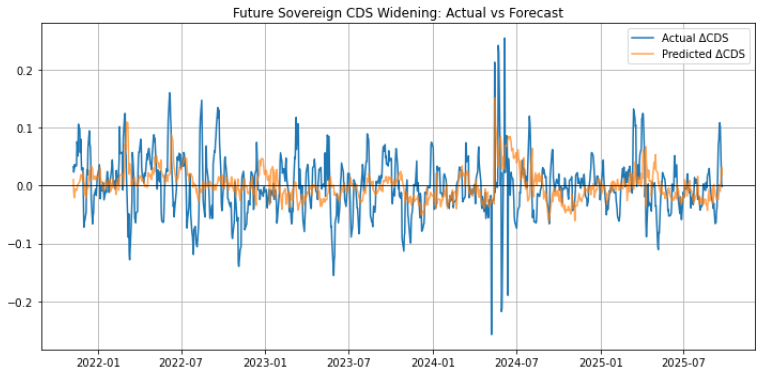
To evaluate the model’s predictive performance, I compared actual CDS movements with model forecasts, as shown in the figure below.
(Actual vs. Predicted CDS Movements)
The chart shows how well the model tracks changes in sovereign credit risk over time.
From the results, we observe that:
The model is able to capture major swings in CDS movements
It successfully identifies large widening episodes, including crisis-like spikes
Predictions generally follow the overall trend, though they are smoother than actual movements
Errors increase during highly volatile periods, which is expected in financial markets
Key Takeaways
Sovereign risk is highly connected across countries
Risk increases and spreads during crises
Downside risk is stronger than upside movements
Global markets act as a network
Data can help us detect and predict risk
Tools & Methods
Python (pandas, numpy)
DCC-GARCH
Copula models
VARX / Spillover index
Final Thoughts
This project shows how data and quantitative models can help us better understand global financial risk. By analyzing how countries are connected, we can build better tools for risk management and decision-making.
Reference
Coia, A. (2013, April 1). VW growing plants with strong routes in North America. Automotive Logistics. https://www.automotivelogistics.media/supply-chain-planning/vw-growing-plants-with-strong-routes-in-north-america/205551
Bloomberg. (n.d.). Sovereign CDS data. Bloomberg Terminal.


