Fixed Income Transaction Cost Adjustment and Yield Curve Modeling

Introduction
The yield curve is often seen as a signal of the economy. It reflects expectations about growth, inflation, and interest rates, and its shape changes as market conditions evolve. A natural question is whether these signals can be used to make better investment decisions. This project explores how to turn yield curve signals into a simple, data-driven strategy.
Understanding Market Signals
One of the most important signals comes from the spread between long-term and short-term interest rates, such as the 10Y-3M yield. When this spread turns negative, known as an inversion, it has historically been associated with future recessions.
In many cases, the market reacts before the broader economy, suggesting that the yield curve can act as an early warning signal.

Linking Markets to the Economy
To better understand this relationship, yield curve signals were compared with macroeconomic indicators such as inflation and unemployment. A consistent pattern appears: the yield curve tends to move first, while economic data follows later. This reinforces the idea that financial markets often incorporate expectations faster than traditional economic measures.
Modeling the Yield Curve
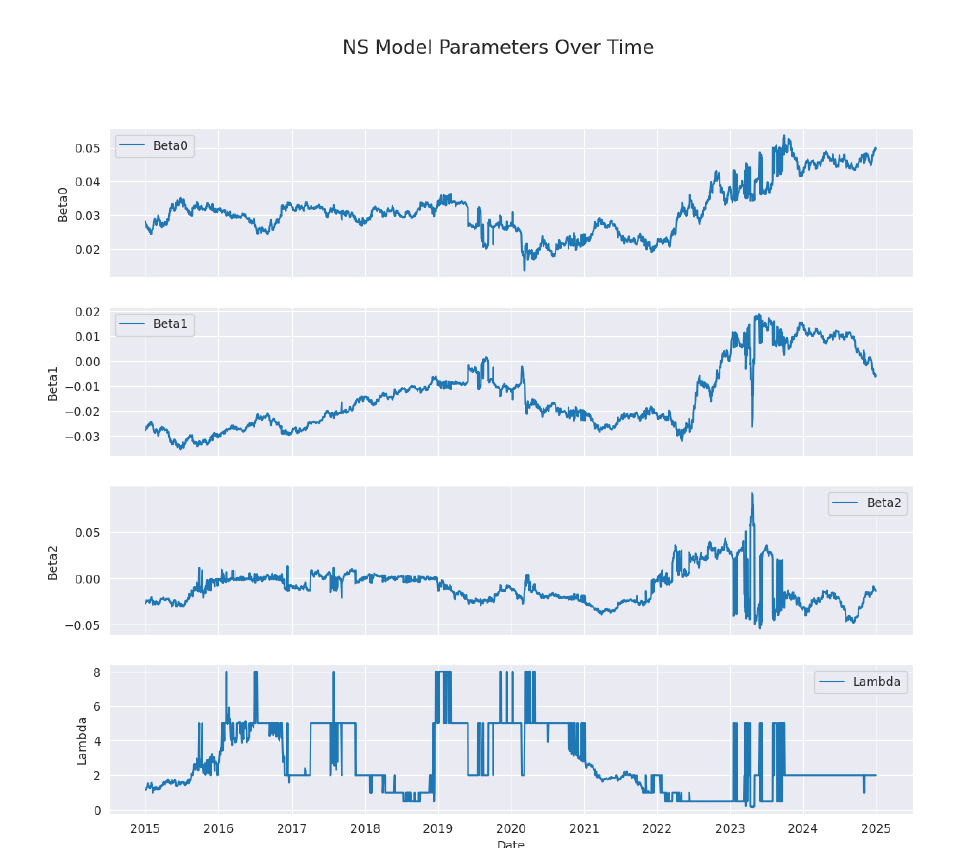
To describe the shape of the yield curve, different modeling approaches were used. A simpler model provides stable and interpretable results, while a more complex model offers flexibility but can become unstable during volatile periods. The results suggest that simpler models are more reliable for forecasting, especially when market conditions are uncertain.


From Signals to Predictions
These signals were transformed into features such as slope, curvature, and trend indicators to predict future movements in yields. Different modeling approaches were tested, from simple linear models to more complex machine learning methods. Interestingly, simpler models performed just as well—and often more consistently—highlighting that in financial markets, complexity does not always lead to better results.

The Reality of Trading
Building a model is only part of the story. Real-world trading involves transaction costs, which can significantly affect performance. When these costs are included, strategies that rely on frequent trading see reduced returns. This shows that ignoring trading frictions can lead to overly optimistic results.

Market Stress and Risk
During periods of market stress, such as yield curve inversions, these challenges become even more pronounced. Trading activity increases, liquidity tightens, and costs rise sharply.
As a result, strategies need to be designed not only for accuracy, but also for robustness under stressed conditions.
Key Takeaways
The yield curve is a strong signal of future economic changes
Market signals often move before economic data
Simple models can be more reliable than complex ones
Transaction costs have a real impact on performance
Market stress amplifies trading risks
Final Thoughts
This project shows that building a successful strategy requires more than prediction alone. By combining clear signals, simple and stable models, and awareness of real-world constraints, it is possible to turn data into meaningful and practical investment decisions.


